This Blog Provides Extended Knowledge on Frequency Distribution Table to Help You Understand and Deliver Correct Data
Affordable Prices
Top Grades at Cheap Rates!
Paraphrasing Tool
Add variations in content without altering the meaning.
Grammar Checker
Remove grammatical errors, typos and spelling mistakes.
Essay Typer
Impressive Essays in Minutes with Best Essay Typer Tool.
Plagiarism Tool
Check similarity in content & get a free plagiarism report.
Thesis Generator Tool
Create a Mesmerizingn Thesis Statement with our tool.
Dissertation Outline Tool
Create a concise dissertation summary with our tools help.
AI Essay Writer
Acquire top-quality essays with original content and no grammatical errors.
Have you seen your mark sheet? It is a frequency distribution table or its form as it provides details about your performance in different subjects. It is easy to read and analyse, isn't it? Now, put yourself into the shoes of your professors and ask how they manage to read and understand your annual result. It just kicked up a notch, right? Why? Because the data just multiplied to the heavier number. That is where frequency tables come to the rescue, as they help you examine the data from different angles to get accurate outcomes. Here comes a problem. The second you read this method, you start applying it to your work. That is what provides negative results as you do not attempt to ask, What is a frequency table?
Thus, this blog initiates the learning process from zero by answering this question first to set an informative base. So, stay attentive to grasp the concept.
Meaning act as a summary of the topic to understand the area it operates. So, it is essential to learn and interpret the meaning behind it. Hence, below mentioned is the definition in simple context:
“The term frequency distribution table is a construct containing three individual concepts:
Thus, when you combine the above-given three concepts to form one construct, you make frequency distribution table. So, the definition of this term is, “A table or an Infographic that helps to arrange the collected information into a sequence or an order to amplify its meaning.” So, you can summarise it as a table for readers with simplified data.
Also, it contains an easy-to-remember structure. The frequency graphs have two columns, variables or figures and their occurrence. It helps check the times a specific digit appears in a group or individual reading. Let us see an illustration to understand:
For example, a teacher conducted tests of 50 marks. The following table shows the variation in grades of the entire class:
|
Marks Groups |
Frequencies |
|
0-10 |
2 |
|
11-20 |
4 |
|
21-30 |
6 |
|
31-40 |
5 |
|
41-50 |
3 |
|
Total |
20 |
The above frequency table example shows a simple demonstration of what it looks like. However, you need to remember a few features while drafting it. Hence, the following section provides valuable details on them.
You may also like to read - How to Calculate the Tough Marginal Cost in Business Economics Assignment?
Features help you interpret what it contains to draft it with less difficulty. It also highlights the shadowed concept behind the entire calculation. They hold huge importance if you aim to learn it. Hence, the following are the features of the frequency distribution table:
Let us examine them further.
This process contains more names, like a measure of central location, that gives a clue about its method. It works to read the collected data through a single digit or variable representing the median part of the lot. A frequency bar chart is calculated using the following methods it contains:
This method contains a heading, dispersion, which means observing the data at a wider scale. In the scope of statistics, it is a process to measure the variation in distributing the facts to an extended range. A frequency distribution table requires the following methods:
The above methods explain the parameters to calculate this table. However, calculation cannot demonstrate the correct analysis, as you need to know how to make it. If you fail to design it accurately, you fail to reach the desired result. Thus, the following section covers the steps you need to construct a correct frequency distribution table.
Every piece of creation, like a pie chart, bar graphs, or other graphical images, requires a ladder approach. It is known to list the essential steps in a sequence to ensure the process does not skip a vital element. You apply a similar mechanism to draft the table to find out frequency distribution.
So, it is time to delve into such steps to know the actual order of drafting this index directory:
Step-1: The initial step is generic yet quite substantial in its making. You need to know it should have clarity, so make two columns in the table and name the first one per the data you collected. Thus, the second becomes the frequency, but you can add tally marks in a third column for better presentation.
Step-2: The next step decides the type of table you want to construct. It depends on the data you collect as you observe and find the category it is falling in. Write the data in their respective column of the frequency distribution table.
Step-3: Here, you need to check for the frequency of each variable in the list. Simply, you need to count the number of repetitions of each digit to learn its occurrence.
Step-4: Once you have filled up the frequencies, learn the best method associated with the category of table you are framing. Follow the necessary procedure to find the conclusion.
Step-5: Apply the required technique and find the correct answer to demonstrate the accuracy of your work.
These are the necessary steps you should keep in mind while drafting it. After learning these steps, you come close to answering the question you asked earlier, “What is a frequency distribution table?” However, there is more to it than you know right now. Therefore, the below section covers its classification you should know.
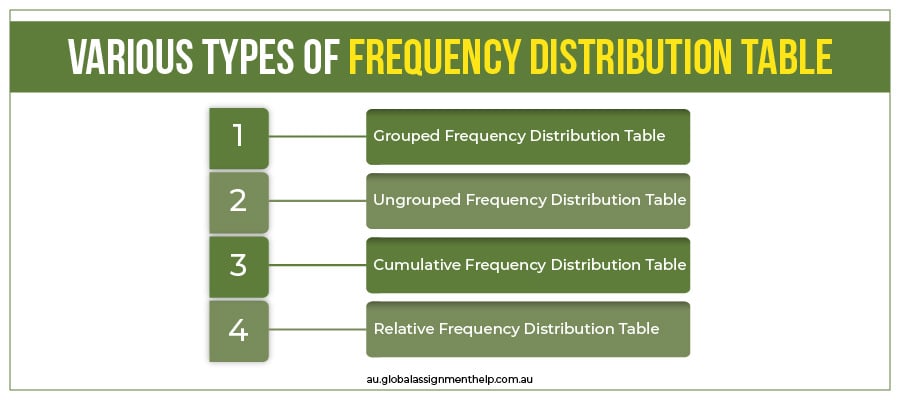
Thinking of it as an ordinary directory is your first mistake while making it. There are various divisions under this, and since you are drafting it, you must develop some idea about them. So, the following are the categories of frequency graphs you can create:
This type consists of data divided or mentioned in the table under specific classes or groups. It does not keep a discrete indication but ranges the data. It observes the data and sees if it is required as grouped or presented individually. This type allows you to study large quantity of information by dividing it into compressed intervals. Moreover, you can find valuable perception through minimal observation. You can ask for
When you aim to acquire a specific frequency of the data, these types of frequency graphs come in handy. While its counterpart indicates the data in different classes, this one puts them individually to find the occurrence of the specific digit. Many of you ask for maths assignment help from experts as you do not know one condition. The data should be limited and short. You can see the below-mentioned illustration for you:
|
Obtained Marks in Exams |
No. of Students |
|
25 |
3 |
|
20 |
6 |
|
15 |
4 |
|
10 |
5 |
|
5 |
2 |
|
Total |
20 |
These frequency graphs help you see the data count from below or above. You obtain this result through the running-total process, where you add the frequencies to get a cumulative outcome of their occurrence. In this method, sometimes you calculate percentage ranks, as well, for better understanding. You can understand the working from the below-mentioned illustration for frequency table example:
|
Marks Groups |
Frequencies |
Cumulative Frequency (Cf) |
Cumulative Percent (CP) |
|
0-10 |
2 |
2 |
10 |
|
11-20 |
4 |
6 |
20 |
|
21-30 |
6 |
12 |
30 |
|
31-40 |
5 |
17 |
25 |
|
41-50 |
3 |
20 |
15 |
|
Total |
20 |
100 |
When you are appointed or assigned to find the part of the distribution from its frequency, this is the one you can adopt. This type of frequency distribution table helps to find the fractions out of the sum of the occurrence. It specifies the area percentage a data covers in the total number of repetitions. Divide the frequency value from its total and multiply it by 100.
The discrete type focuses on the distinct values from the distribution. It does not create any class groups but denotes the frequencies on the basis of repetition. However, continuous create classes to represent the reading of the data. But it does it with a slight change by continuing the group with the last digit from the previous set.
Frequency graphs contain these classifications, so you should not frame this directory without learning about them. However, as you know more, you have more questions. So, the following section covers such queries you frequently ask about this topic.
You may also like to read - 10 Apps That Must Be Installed on Every Economics Student's Phone
Frequency graphs help you arrange the data to know about their occurrence to find accurate results. Its purpose is to understand the complex data in fewer hours and can give you a glance even if the digits are much in quantity.
First, you need to collect and interpret the collected data. Second, understand the type to assign the right table type for it. Third, count the frequencies of the values and last, calculate the sum of the occurrence.
Outliers stand at an unquantified distance from the central digit. If the data contains much of them, dispersion and central location face the impact. However, the median and mode remain un
Understanding the concept of frequency tables is difficult, so you need from the best experts. Therefore, our platform, Global Assignment Help Australia, comes to your rescue as we have the best team of professionals with top-level specialisation in various academic fields. So, if you have any issue, problem or query in your course, you come to us and ask for online assignment help from our team of experts.
You may also like to read:-
Transition Words: Meaning, Importance and Its Vital Types
Statement of Purpose: Meaning, Importance, and Valuable Elements
A Great Manual Explaining Network Protocols and Its Working
Want to Crack Math Homework Problems with Fun? Try These Places

Grab this exclusive offer and start your journey to savings today! Act quickly, as this special offer won't be around for long!

This blog explains what is a hyperbole, provides engaging examples, & explores how to use hyperbole.

Explore 150+ funny debate topics to spark laughter, creativity, and lively discussions in 2025

Cross-Sectional Study basics explained with steps, examples, and comparisons.
Limited Time Offer
Exclusive Library Membership + FREE Wallet Balance
1 Month Access !
5000 Student Samples
+10,000 Answers by Experts
Get $300 Now
![]() Update your Number
Update your Number


 Call us: +61 483982483
  Whatsapp: +61 483982483
  help@globalassignmenthelp.com.au